Your SMS dashboard says parts gross profit is 45%. Healthy, right? Except your matrix is set to 52%, your advisors are discounting, and you wrote off $11,000 in cores last year — so the real number is 38% and quietly bleeding.
Most shop owners track one parts number. There are nine that actually tell you whether your margin is healthy, and your shop management system can only calculate about five of them.
Why One Parts Number Lies to You
For most shop owners, the back office is a battlefield of paperwork — and the parts side is the bloodiest corner of it. So you do the reasonable thing. You open Tekmetric or Shop-Ware on Monday morning, find the parts gross profit line, see a number that looks fine, and move on to the eleven other fires waiting for you.
That single number is a blended average. It smears your well-priced jobs and your leaking jobs into one figure that looks healthy because the good jobs are carrying the bad ones. It hides the four places parts margin disappears: wrong matrix selection, service advisor discounting, parts added at zero cost, and unreturned core charges. None of those four show up as a red number on the dashboard. They show up as a GP% that’s “a little lower than I’d like” — and stays there for years.
These nine auto repair parts KPIs and benchmarks are the full scorecard. For each one you’ll get the target band, the exact formula, and the annual dollar cost of being off-benchmark — all modeled on the same single-rooftop $2M shop so the numbers are comparable. Some of these your SMS computes for you in two clicks. Some of them it structurally cannot, because the data it needs lives in vendor statements, vendor credits, and your bank feed — three places the SMS was never built to look.
Here’s the honest framing before we start. Your SMS is excellent at the easy ratios. It tells you what you charged. It was never built to tell you what you should have charged and kept, because that answer requires reconciling three systems it doesn’t own.
How to Read This Scorecard (and Where the Data Lives)
Before the list, get the plumbing straight, because half the value of a parts scorecard is knowing which system holds the truth for each metric.
- Your SMS (Tekmetric, Shop-Ware, Mitchell 1, NAPA TRACS, Protractor, Fullbay, RO Writer) holds the RO and the parts-sale side — what you billed, what the matrix was set to, what got discounted on the ticket.
- QuickBooks holds the cost and GL side — your COGS, your true landed cost once freight and adjustments are in.
- Vendor statements and bank feeds hold the credits and the actual money — core credits, warranty credits, return credits, billing-error adjustments, and proof they hit your account.
That split creates two buckets of KPI:
- Performance KPIs your SMS can mostly calculate on its own — gross profit, parts-to-labor, discount rate, turns, obsolete stock.
- Leakage and recovery KPIs that require reconciling all three systems — matrix variance, core recovery, special-order returns, vendor credit recovery. No single system owns these, which is exactly why they go unmonitored.
Throughout, we’ll use one model shop. Call him Hank — a single rooftop doing roughly $2M in revenue and about $520K in annual parts sales. Every dollar-cost calculation below runs against Hank’s numbers, so by the end you can stack them into one total.
One caveat on the benchmark bands: they’re directional industry ranges, not gospel. Tune them to your mix. A Euro specialist or a heavy-line/driveline shop runs different parts-to-labor and turns numbers than a maintenance-heavy general repair shop. Use the bands as a starting line, not a verdict.
1. Parts Gross Profit % (Parts GP%)
The headline number — and the one most likely to mislead you.
Formula: (Parts Sales − Parts Cost) / Parts Sales. Pull parts sales and COGS from your SMS, then verify cost against QuickBooks landed cost so freight and adjustments aren’t hiding margin.
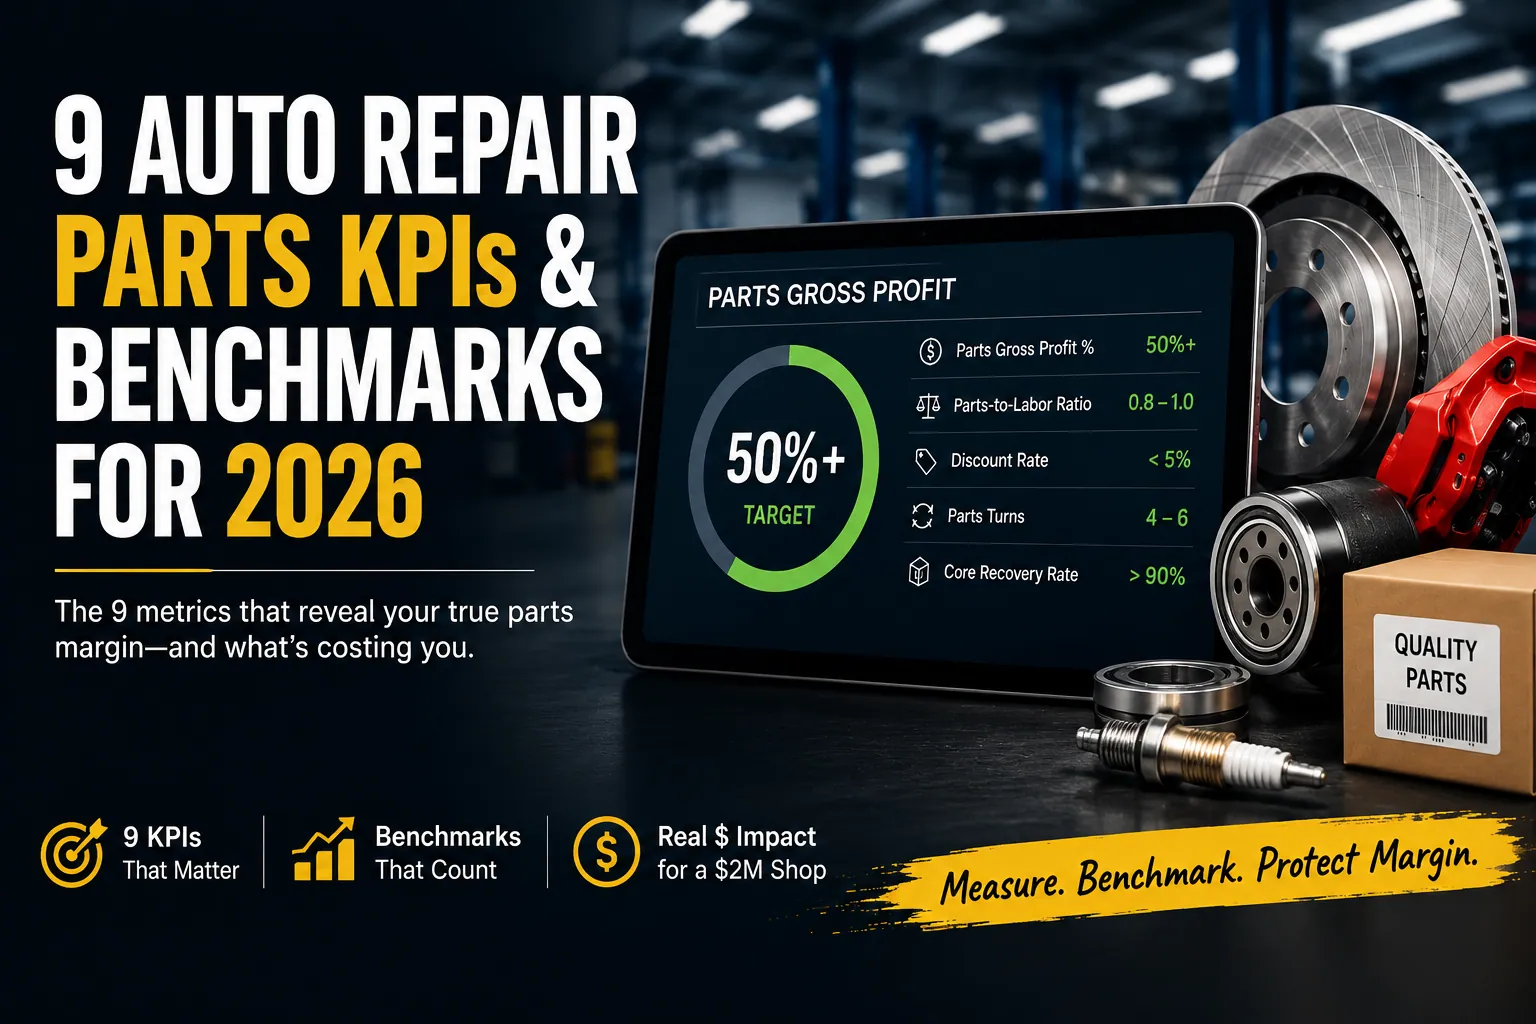
Benchmark band: 45–55% blended for general repair, with 50%+ as the target floor for a healthy, matrix-driven shop. (Industry benchmark data from sources like Ratchet+Wrench and 20-group financials puts well-run shops at or above this line.)
What off-benchmark costs: On Hank’s $520K of parts sales, every single point of GP% is worth $5,200 a year. Drift from a 50% target down to 44% — a six-point slide that’s easy to miss on a dashboard — and that’s roughly $31,200 a year gone.
Here’s why the headline lies. That 44% is blended across every job: the well-matrixed brake job at 52% and the leaked job that went out at cost are averaged into one number. A “fine” average can sit right on top of a broken matrix tier, and you’d never see it. Which sets up KPI #3.
Before you touch anything else, make sure the matrix itself is sound. Our guide on how to build a parts pricing matrix that holds walks through the tier structure that produces a defensible 50%+ floor in the first place.
2. Parts-to-Labor Ratio
A health check that catches problems GP% can’t — because it compares two sides of your business against each other.
Formula: Parts Sales / Labor Sales, in dollars, measured over the same period.
Benchmark band: Roughly 0.8:1 to 1:1 for general repair. It skews higher for heavy-line and driveline work (parts-heavy by nature) and lower for diagnostic- or maintenance-heavy shops. Know your own normal.
What off-benchmark signals: A ratio sliding below your band can mean parts are being billed at cost, parts are getting added to ROs with no markup, or labor is being given away. It’s not always a parts problem — but it’s always a flag worth pulling the thread on.
Dollar framing: Say Hank’s mix should run 0.9:1 and he’s actually at 0.7:1 on $580K of labor sales. At 0.9:1 he’d expect about $522K in parts revenue; at 0.7:1 he’s pulling $406K. That’s roughly $116K of expected parts revenue under-captured annually. The ratio doesn’t tell you why — it tells you to go look. Often the answer is parts billed at zero cost on the RO, which drags both this ratio and your GP% down at once.
This is the one ratio a prior post argued in depth — see why the parts-to-labor ratio matters for the full breakdown. Treat this post as the nine-metric scorecard that ratio lives inside.
3. Realized vs. Matrix Price Variance
The first KPI on this list your SMS effectively cannot give you cleanly — and one of the most expensive blind spots in the shop.
Formula: (Matrix-expected parts price − Actually-billed parts price) / Matrix-expected price, aggregated across every RO.
Benchmark band: Variance should sit under 2–3% of parts revenue. Anything higher means matrix overrides have stopped being exceptions and become routine.
What it catches: The gap between policy and reality. Wrong matrix tier selected at the counter. Manual price overrides. Parts that defaulted to cost because nobody assigned a tier. Your matrix is a policy document; this KPI measures whether the shop actually follows it.
Dollar cost: A 5% realized variance on Hank’s $520K is $26,000 a year — money your matrix said you should have charged and simply didn’t.
Here’s the structural problem. Your SMS shows you the price it charged. It does not show you the price it should have charged, because it doesn’t compare each line item back against your matrix policy after the fact. This is where WickedFile computes the variance — comparing SMS line items against the matrix policy across every RO and surfacing the gap. If you want to understand the single biggest driver here, read how the wrong matrix tier quietly eats margin.
4. Discount Rate as % of Parts Revenue
Discounts are the purest form of margin give-back there is. Near-100% of every discounted dollar comes straight off the bottom line.
Formula: Total parts discounts (dollar value) / Gross parts revenue before discounts. Source the discount lines from your SMS RO detail.
Benchmark band: Under 1.5–2% of parts revenue for a shop with a tight discount policy.
What off-benchmark costs: At 4% on Hank’s $520K, that’s $20,800 a year off the bottom line. And because a discount has no offsetting cost, every dollar of it is a dollar of profit you handed away.
The behavioral angle is what makes this one sneaky. A service advisor discounts a few parts to “save the sale” — ten dollars here, a courtesy fifteen there. No single adjustment looks like anything. But thousands of small line adjustments add up, and no one ever totals them by person. The SMS shows discounts per ticket. It does not roll them up by advisor across the month so the pattern is visible.
That roll-up is what WickedFile does — every advisor discount aggregated by advisor and by RO, so a single soft-hearted counter person stops being invisible. For the full mechanics, see our case study on how advisor discounting drains parts margin.
5. Core Return Rate
Real money sitting in a bin by the back door — measured.
Formula: Cores actually credited / Core-eligible parts purchased — track it both by count and by dollar.
Benchmark band: 95%+ of eligible cores returned and credited. Below 90% means there’s cash in the core bin you’re treating as scrap.
What off-benchmark costs: Run the math on Hank. Sixty core-eligible jobs a month, a 15% walkaway rate, $75 average core: 60 × 0.15 × $75 = $675 a month, or roughly $8,100 a year unrecovered.
Why your SMS misses it: the SMS logs the core charge when it’s billed. But the matching credit lands on a vendor statement weeks later, in a different system, on a different timeline. Reconciling the charge against the eventual credit is the gap — and it’s a gap nobody has time to close by hand. WickedFile matches expected core credits against the credits that actually appear on the vendor statement and alerts on the ones that never came back. Same idea as the deposit on a glass soda bottle: you paid it, you’re owed it back, and somebody has to actually carry the bottle to the counter. To put a number on your own exposure, audit your core charge liability.
6. Special-Order Return Rate
The quiet cousin of the core problem — and a frequent first step toward dead stock.
Formula: Special-order parts returned for credit / Special-order parts never used (wrong part, job canceled, customer declined).
Benchmark band: Keep unreturned special-orders under 3–5% of special-order spend, restocking fees factored in.
What off-benchmark costs: Model $400 a month in unreturned special-orders for Hank — about $4,800 a year — plus the cash tied up sitting on the shelf.
The operational cause is almost always the same. The part came in. The job changed — customer declined, vehicle never came back, wrong part for the application. And the return window closed quietly because no one owned the follow-up. Three weeks later it’s a $90 sensor nobody can return and nobody can sell.
WickedFile flags special-order purchases that have no matching customer sale and no return credit — so the part gets back to the vendor while the window’s still open, instead of becoming a write-off six months later.
7. Vendor Credit Recovery Rate
This is money the vendor already owes you. You just have to prove you’re owed it.
Formula: Vendor credits actually received / Credits owed (returns + cores + warranty + billing-error adjustments).
Benchmark band: 95%+ recovery. The gap is collectible money you never collected.
What off-benchmark costs: Say Hank is owed $1,500 a month in mixed credits and recovers only 80%. That’s $300 a month walking away — about $3,600 a year.
Here’s why this one needs all three systems at once. You can only see it by reconciling what you returned (your records and SMS) against what the vendor statement actually credited against what hit your bank feed. Miss any one of the three and you’re guessing. This is the exact reconciliation WickedFile was built for: vendor statement line items matched against invoices and credits, flagging the missing ones instead of forcing a line-by-line hunt through a multi-page statement.
And here’s the honesty beat, because it matters. WickedFile finds the missing credit. It does not chase the vendor and it does not move money. When the credit’s missing, you — or your bookkeeper — still call the parts rep. WickedFile just makes sure you know to call, and exactly what you’re owed when you do.
Better still is catching the error before you ever pay it. Recovering a billing-error credit after the fact is the cleanup; the upstream fix is a line-level three-way match that flags the overcharge at the moment the invoice lands. Our vendor overbilling guide walks through exactly that — and because overbilling inflates the cost every KPI on this scorecard is calculated on, it’s the cost-side companion to this post.
8. Parts Inventory Turns
How hard your parts dollars are working — and how much cash is sleeping on the shelf.
Formula: Annual Parts COGS / Average Parts Inventory Value. Pull COGS from QuickBooks and inventory value from your SMS or a physical count.
Benchmark band: 8–12 turns a year for a shop running tight just-in-time ordering. Lower is normal for stocking shops, but under about 6 signals dead capital.
What off-benchmark costs: Tie it to carrying cost. Every extra month of average inventory is real cash locked up plus obsolescence risk. At $40K of average inventory, slow turns mean tens of thousands of dollars frozen in bins instead of working in your business — and the longer a part sits, the more likely it ages into the next metric.
One honest data caveat: many independent shops don’t truly carry parts inventory on the books — they order per job and the part is gone the same week. If that’s you, this KPI matters less. It matters most for stocking shops and heavy-line operations that keep real inventory on the shelf. PartsTech’s guidance for independent shops is a good reference on right-sizing what you stock.
9. Obsolete-Parts %
The bin in the back nobody wants to count.
Formula: Value of parts with no movement in 6–12 months / Total inventory value.
Benchmark band: Keep obsolete and dead stock under 5% of inventory value.
What off-benchmark costs: Not theft. Not fraud. Just old starters and the wrong-fit brake kits sitting in a bin, slowly turning into a write-off. Model $3,000 of dead stock written off a year for Hank — and that’s the clean version, where you actually write it off instead of letting it inflate your inventory value on paper.
Here’s the tie-back that makes the scorecard interlock: obsolete parts very often started life as unreturned special-orders from KPI #6. The part you couldn’t return in March is the dead stock you write off in October. The metrics aren’t independent — they’re a chain.
Owner action: Run a quarterly dead-stock sweep. Return to vendor anything still inside the window. Scrap the rest and write it off cleanly so it stops distorting your turns and your balance sheet.
Putting the Nine Together: Your Quarterly Parts Scorecard
Here’s the whole scorecard in one place — each KPI, its target band, and which system actually computes it.
- Parts GP% — target 50%+ blended — SMS (verify cost in QuickBooks)
- Parts-to-Labor Ratio — target ~0.8:1–1:1 — SMS
- Realized vs. Matrix Variance — under 2–3% — Requires reconciliation
- Discount Rate — under 1.5–2% of parts revenue — SMS (per ticket; aggregation needs a tool)
- Core Return Rate — 95%+ credited — Requires reconciliation
- Special-Order Return Rate — under 3–5% unreturned — Requires reconciliation
- Vendor Credit Recovery Rate — 95%+ recovered — Requires reconciliation
- Parts Inventory Turns — 8–12/yr — SMS + QuickBooks
- Obsolete-Parts % — under 5% of inventory — SMS + physical count
Five of these your SMS can mostly do on its own: GP%, parts-to-labor, discount rate (per ticket), turns, and obsolete %. Four it structurally cannot, because they require comparing the RO side against the cost side against the credit side — matrix variance, core recovery, special-order returns, and vendor credit recovery. Those four are exactly where the unmonitored money lives.
Now stack the leakage scenarios from this post into one annual number for Hank:
- Realized matrix variance (KPI #3): $26,000
- Advisor discounts at 4% vs. a 2% target — the extra two points on $520K (KPI #4): $10,400
- Core return rate at 85% instead of 95% (KPI #5): $8,100
- Unreturned special-orders (KPI #6): $4,800
- Vendor credit recovery at 80% (KPI #7): $3,600
- Obsolete write-off (KPI #9): $3,000
That totals roughly $55,900 a year quietly leaking from an unmonitored scorecard — on a $520K parts book. More than 10% of parts revenue. And none of it shows up as a single red number on the SMS dashboard. It shows up as a parts GP% that’s “a little lower than I’d like.”
Your SMS tells you what you charged. Your scorecard tells you what you should have charged and kept. Both have to be true, or your margin isn’t healthy — it’s just lucky.
How WickedFile Computes the KPIs Your SMS Can’t
Let’s be precise about what WickedFile is. It is not your shop management system, and it is not your accounting platform. It’s the layer between the SMS, your vendor invoices, QuickBooks, and your bank feeds — the layer that compares those systems against each other and surfaces what none of them can see alone. WickedFile CEO Alex Saladna walks through this data-mining approach to parts and expense KPIs with Carm Capriotto on Remarkable Results Radio.
That maps directly onto the four leakage KPIs your SMS structurally can’t compute:
- Matrix variance (#3) — every SMS line item compared against your matrix policy, RO by RO.
- Core recovery (#5) — expected core credits matched against the credits that actually land on vendor statements.
- Special-order returns (#6) — special-order purchases with no matching customer sale and no return credit, flagged before the window closes.
- Vendor credit recovery (#7) — vendor statement line items reconciled against invoices and credits against the bank feed.
And it surfaces them as ongoing alerts, not a year-end surprise. WickedFile Alerts are scheduled monitoring rules that email you when a core hasn’t been credited, when an expected vendor credit never showed, or when a special-order has no matching sale — so the leak gets caught the week it happens, not at tax time.
What WickedFile does not do, plainly: it does not process payments, it does not issue corporate cards, and it does not handle accounts receivable or customer invoicing. You keep your SMS for ROs, QuickBooks for the books, and whatever you use to pay vendors. WickedFile finds the money. It doesn’t move it.
On ROI: the free trial gives you 500 scanned pages with no credit card, which is enough to run a real audit on your own statements. The Grow plan is $299/month with no setup fees. Enterprise is custom for multi-rooftop operators. Against Hank’s roughly $55,900 in modeled annual leakage, the math isn’t subtle — recovering even a fraction of the four reconciliation KPIs covers the subscription many times over. (For broader benchmark context on where these numbers should land, ATI’s 20-group financial data is a solid external reference.)