
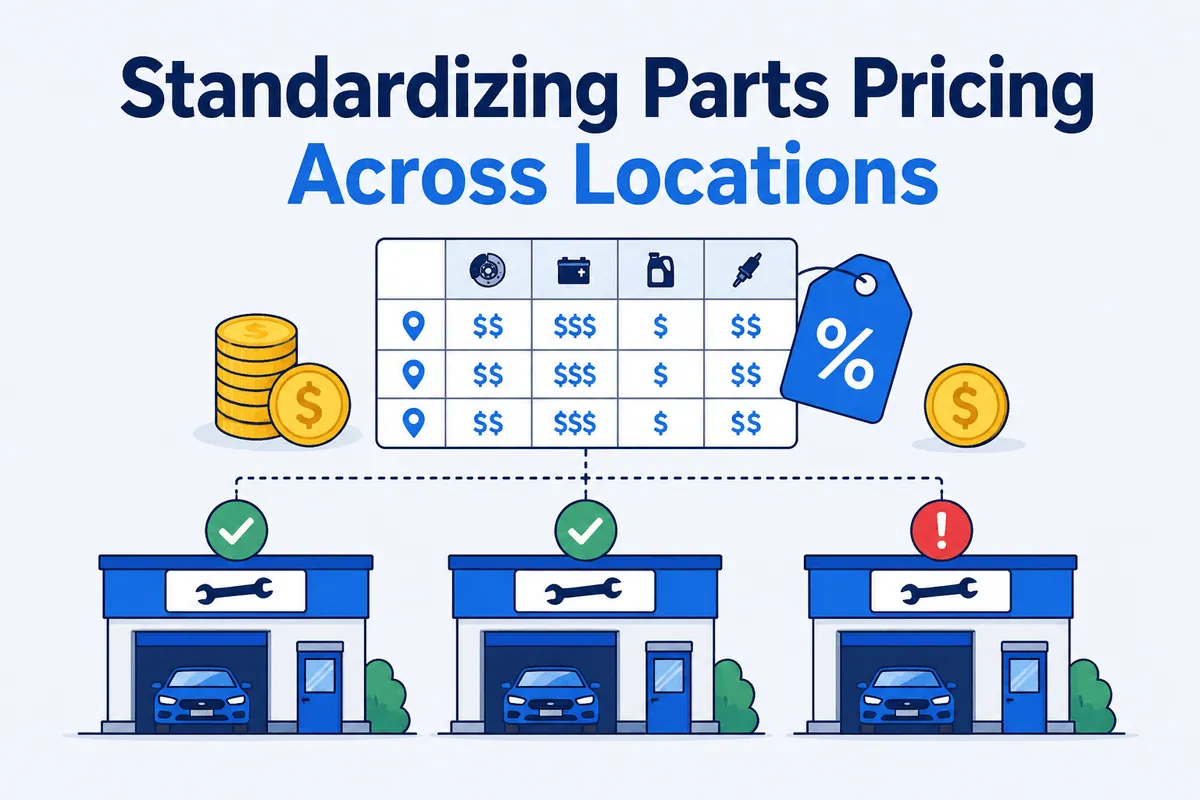

A parts matrix is a lot like my New Year’s resolutions: I set it once, feel very proud of myself, and then quietly stop honoring it by about week three. (My wife says that tracks. My P&L agreed before I fixed it.) If you run a group, you have probably already done the proud part. You set a matrix. Every store quotes off the same numbers. So why does parts pricing across multiple locations still leave money on the table at the end of every month?
Because setting the matrix and holding the margin are two different jobs, and almost every group we work with has only finished the first one. This is a playbook for the owner and the MSO operator, not the consumer, and not the single-store shop that can eyeball its own counter. Read it in five minutes. The fix runs on a weekly cadence, not a redesign.
Here is the part nobody tells you up front. Your matrix is probably fine. Across the groups we see, the published policy is reasonable and competitive. The problem is that realized margin runs 3 to 8 points below that policy, store by store, and the gap is invisible until someone measures it. So before you go rebuilding anything, understand what the actual leak is.
Setting the matrix and holding the margin are different jobs
A parts matrix is a ceiling. It is the highest price your system will quote for a part at a given cost. Everything that happens after that quote can only move the price in one direction. Down.
A service advisor drops a line to close a hesitant customer. A counter person grabs the wrong matrix at intake. A dealer part comes in at OE cost and gets billed on the standard markup table. None of those events touch your matrix. The policy on paper is exactly what you set it to be. The money that actually lands in the bank is something else.
That is why parts pricing across multiple locations is not really a pricing problem. It is a compliance problem. If you have ten stores all loaded with the same matrix and your realized parts gross profit still varies by five or six points store to store, you do not have a matrix that needs redesigning. You have ten stores executing the same policy with ten different levels of discipline, and no system that shows you which is which.
Here is the benchmark to internalize. A well-run group’s realized margin should sit within a point or two of policy. When it runs 3 to 8 points under, that is not market pressure. That is leakage. And the only way to tell the difference is to compare invoiced price against matrix price, line by line, across every store. If you want the underlying markup logic first, our parts markup strategy for profitability covers how a sound matrix gets built in the first place.
The two matrices every multi-location group should run
Standardization does not mean one matrix. It means the same set of matrices at every store, applied the same way.
Most groups need at least two running in parallel. A Standard matrix governs jobber and aftermarket parts, where your cost is reasonable and your markup can be aggressive. A Dealer matrix governs OE parts, which come in at much higher cost and need a different markup, usually a shallower percentage but a higher absolute dollar, so you stay competitive on the quote while protecting gross profit. On top of those, you almost always want sub-matrices for commodity lines. Tires, batteries, and bulbs will not bear the same markup as a control arm, and forcing them onto the standard table either prices you out or leaves margin on the floor.
The mechanics of running these side by side are worth understanding in detail, which is why we wrote up dealer vs. standard vs. list matrix pricing as its own piece. If you want a vendor-neutral primer on the markup logic itself, both Tekmetric’s guide to the auto parts markup matrix and RO Writer’s breakdown of how a parts pricing matrix increases profitability cover the fundamentals well.
The leak here is wrong matrix selection. It happens at the counter, at intake, when a dealer part gets pulled and billed on the standard matrix because that is the default the SMS opened on. The customer pays a fair price. The advisor logs the job. Nobody discounted anything. And you still lost a chunk of margin because the wrong table priced the part. It is a clean getaway. No fingerprints, no note, no suspect.
Here is what that costs (figures illustrative). Say a dealer-sourced part lands at $400 cost. Your dealer matrix marks that to roughly $620, a $220 gross profit line. Your standard matrix, tuned for $40 jobber parts, marks a $400 cost to roughly $560, a $160 line. The difference is $60 of margin on that one part, gone, because it was billed on the wrong matrix.
Now scale it. A busy store runs a meaningful share of OE parts through the counter. If your group books, conservatively, fifty dealer-part lines a week that get mis-billed on the standard matrix at an average $60 difference, that is $3,000 a week, per store, on this one mechanism alone. On big OE jobs at a high-volume location, the mis-matrix gap can clear $200-plus per affected ticket. Across eleven stores it is the kind of number that never shows up anywhere on the P&L, because the parts still sold at a profit. Just the wrong one.
That is the whole trick of this leak. It is silent by design, because the parts never stopped being profitable.
Discount drift is the bigger multi-location leak
Wrong matrix selection is real money. Service advisor discounting is usually bigger.
Here is the pattern, and it is almost universal. Your corporate discount policy caps total discounts at 7% of revenue. You have documented exceptions for fleet and advertised promos. On paper, disciplined. Then someone pulls a real report on what actually got invoiced, and the aggregate discount rate comes in at 12%, 13%, often north of 14%. Nobody logged an exception. Nobody flagged a problem. The margin just walked off the lot, one reasonable-feeling discount at a time.
The reason it hides is that most of it is not even a “discount” in the system. An advisor with a customer hesitating on a $1,200 brake job does not ask a manager for an approved markdown. They drop the brake pad line from $320 to $280 and the rotor line from $260 to $230, the customer says yes, and the matrix-defined price never appears on any report. It got absorbed into the part price. We break the mechanisms down line by line in how service advisor discounting kills parts gross profit, but the headline is this: the visible RO-level discounts your SMS tracks are the small half of the problem.
Now the math (figures illustrative). Take an 11-location group. Policy cap, 7%. Realized rate, roughly 14%. That 7-point gap, applied across the group’s parts and labor revenue, comes out to about $20,000 a week in off-policy discounting. Run that across a 50-week year and you are at roughly $1 million annually in margin given away with no approval, no logged exception, and no single advisor who feels like the problem.
Here is my one strong opinion on this, and I will own it: most groups do not have a discounting problem, they have a visibility problem. The 7% cap is fine. The matrix is fine. The advisors are not villains. The gap between the policy and what gets invoiced is the entire issue, and it only closes when you can see it store by store and advisor by advisor. You cannot manage a number you have never once put on a screen.
How to measure compliance every week, across every store
Matrix compliance across multiple locations is a measurement job, and it runs on a weekly cadence, not a quarterly one. Here is the report you actually need. It has three moving parts.
One: invoiced price versus matrix price, per line. For every parts line sold, compare what was billed against what the matrix said the price should be at that cost. Any line invoiced below matrix is either a wrong-matrix selection or a baked-in discount. Flag it, name the store, name the advisor, total the dollars.
Two: RO-level discount versus the cap, per ticket. For every repair order, compare total applied discounts against your 7% policy cap. Flag every RO over the line. This catches the visible discounts, the fat-finger typos, and the one-off “I owe this customer” comps.
Three: a flag-and-total rollup, per store. Aggregate the two above into a single weekly number per location: total dollars sold below policy this week. That number goes into your weekly operations review next to revenue. When a store manager knows the off-policy total gets read out loud every Monday, the gap stops widening. Visibility is most of the enforcement.
The cadence matters more than the precision. A perfect report you run once a quarter lets three months of drift compound. A good-enough report you run every week catches it while it is still this week’s problem. Pair this with the right parts and labor KPIs and benchmarks so each store’s compliance number sits next to the gross-profit targets it is supposed to protect, and read parts vs. labor margin to know which side of the ticket each store is actually leaking.
Rolling a standard onto a new acquisition
If you are an MSO, you are probably buying shops, and a newly acquired store is where standardization gets tested hardest.
On day one, you load your corporate matrices. That part is mechanical. What you cannot load is muscle memory. The acquired shop has its own discounting habits, its own counter defaults, its own definition of what “closing a job” requires. The previous owner may have run a looser policy, or no real policy at all, and the advisors you inherited have been pricing that way for years. You can hand them a new matrix on Monday; you cannot hand them a new reflex.
So treat the first 60 to 90 days as a compliance ramp, not a switch-flip. Run your weekly compliance report on the new store specifically, isolated from the group, and compare its realized margin against your established-store baseline. The new store’s gap will almost always start wider, often well past the 3-to-8-point band your seasoned stores run. That is expected. The point is to make it visible from week one, name the dollars, and close it deliberately, before the acquired shop’s habits drift into your group’s averages and disappear into the blended number. A shop you bought for its revenue can lose a real share of its gross profit in the handoff if nobody is measuring the parts line against the matrix you just loaded. Your group-level accounting should reconcile at the store level too, which is the whole point of multi-location auto repair accounting.
The reconciliation layer that makes a standard enforceable
You can build the report described above by hand. Some operators do, pulling exports out of their SMS and grinding them in spreadsheets. It works until it doesn’t, which is usually around the fourth store, when the manual pull stops being weekly and starts being whenever-there-is-time. (Spreadsheets are great right up until they are load-bearing.)
This is the gap WickedFile fills. It sits as the reconciliation layer between your shop management system, your vendor invoices, your QuickBooks, and your bank feeds, across every location, and it surfaces every parts line sold below policy: the wrong-matrix selections, the baked-in advisor discounts, parts added at zero cost, the unreturned core charges. The value of running them through one layer is that you get the store-by-store, advisor-by-advisor compliance number without anyone exporting anything. If you want to understand where it fits next to the stock-counting tools that do not read invoice dollars, automotive parts inventory software draws that line.
Be clear about what this is and is not. WickedFile does not set your matrix, and it does not change your prices. You own your pricing policy. It surfaces every line sold below it so you can enforce. It does not process payments, issue corporate cards, or handle accounts receivable and invoicing. It is not a bill-pay platform, and it does not replace your SMS or your QuickBooks. It is the reconciliation layer between them, built specifically for auto repair, that turns a published matrix into a margin you actually realize.
Parts pricing across multiple locations is not about a better matrix. Most of you already have an acceptable one. It is about closing the 3-to-8-point gap between the policy you published and the prices your stores invoice, week after week, location after location. The matrix is the floor plan. Compliance is whether the building got built to it.
Book a demo and we will show you, on your own numbers, exactly where the gap between policy and realized margin is hiding across your stores. We will probably also tell you a terrible joke. Consider that a bonus, not a warning.